- simulx() to run the simulation
- prctilemlx() to plot prediction intervals (with overlay of the groups on a single plot)
- writeData() to write the simulation results to a MonolixSuite compatible format – This feature is now available directly in the interface and in the API with exportSimulatedData.
prctilemlx(): prediction interval plots
Description
Compute and plot percentiles of the empiricial distribution of longitudinal data. When several groups are present, the groups can be plotted as subplots or as different colors on one plot. The input can be a R object (parameter r) or a monolix project and a variable name (arguments project and outputVariableName).
Usage
prctilemlx(
  r = NULL,
  col = NULL,
  project = NULL,
  outputVariableName = NULL,
  number = 8,
  level = 80,
  plot = TRUE,
  color = NULL,
  group = NULL,
  facet = TRUE,
  labels = NULL,
  band = NULL
)
Arguments
r |
a data frame with a column id, a column time and a column with values. The times should be the same for all individuals. |
col |
a vector with the three column indexes for id, time and y. Default = c(1,2,3). |
project |
simulx project filename (with extension “.smlx”) |
outputVariableName |
name of the output to consider. By default the first output will be consider. You must define either a ‘r’ dataframe (and the associated ‘col’ argument) or a simulx project and the name of the output ‘outputVariableName” |
number |
the number of intervals (i.e. the number of percentiles minus 1). |
level |
the largest interval (i.e. the difference between the lowest and the highest percentile). |
plot |
if TRUE the empirical distribution is displayed, if FALSE the values are returned |
color |
colors to be used for the plots In case of one group or facet = TRUE, only the first color will be used |
group |
variable to be used for defining groups (by default, ‘group’ is used when it exists) |
facet |
makes subplots for different groups if TRUE |
labels |
vector of strings |
band |
is deprecated (use number and level instead) ; a list with two fields
|
Details
You must define either a dataframe r (and if needed the associated col argument) or a simulx project and the name of the output outputVariableName. The outputVariableName corresponds to the name of the model variable, not to the output element name.
Value
a ggplot object if plot=TRUE ; otherwise, a list with fields:
- proba: a vector of probabilities of length
band$number+1 - color: a vector of colors used for the plot of length
band$number - y: a data frame with the values of the empirical percentiles computed at each time point
Examples
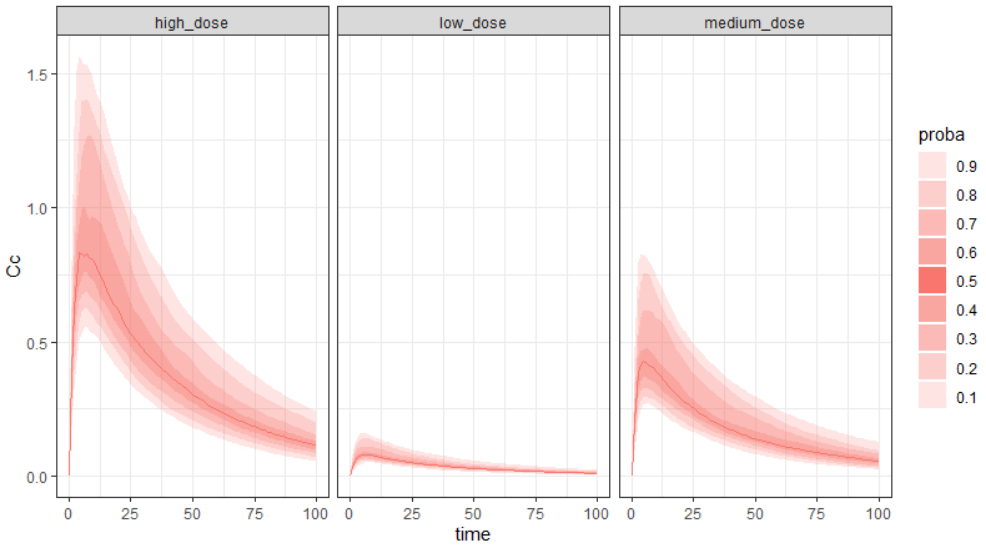
This simulx-GUI demo project contains 3 simulation groups, with a low, medium or high dose. In the Simulation tab, the output element ‘regularCc’ is selected, to output the variable ‘Cc’ on a regular time grid.
With facet=T (default), each group is displayed on a separate subplot with the different shades representing different percentiles. The largest band represents the 90% prediction interval.
project.file <- "~/../lixoft/simulx/simulx2020R1/demos/5.simulation/simulationGroups_treatment.smlx"
prctilemlx(project=project.file, outputVariableName = "Cc")
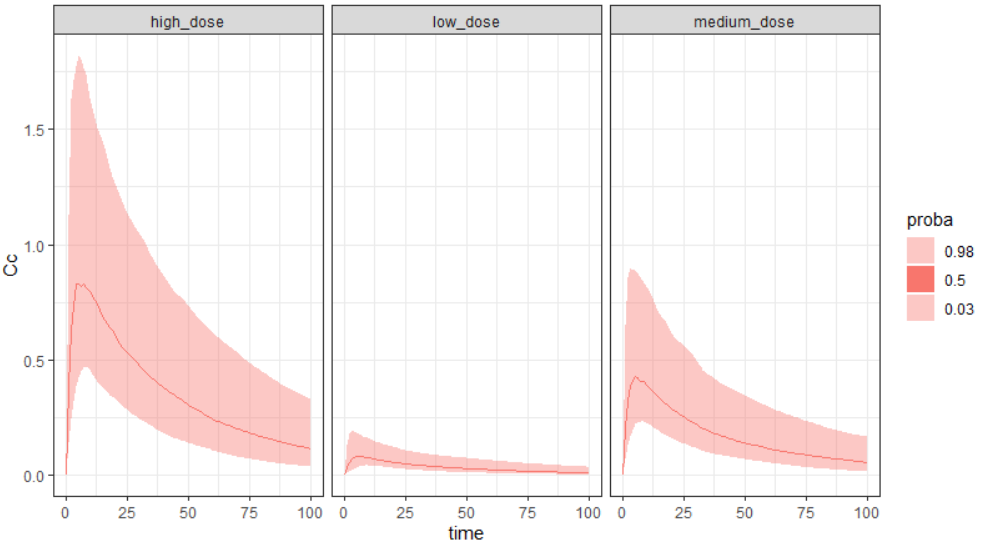
With number=2 and level=95, we can select to display only the median and the 95% prediction interval.
project.file <- "~/../lixoft/simulx/simulx2020R1/demos/5.simulation/simulationGroups_treatment.smlx"
prctilemlx(project=project.file, outputVariableName = "Cc", number=2, level=95)
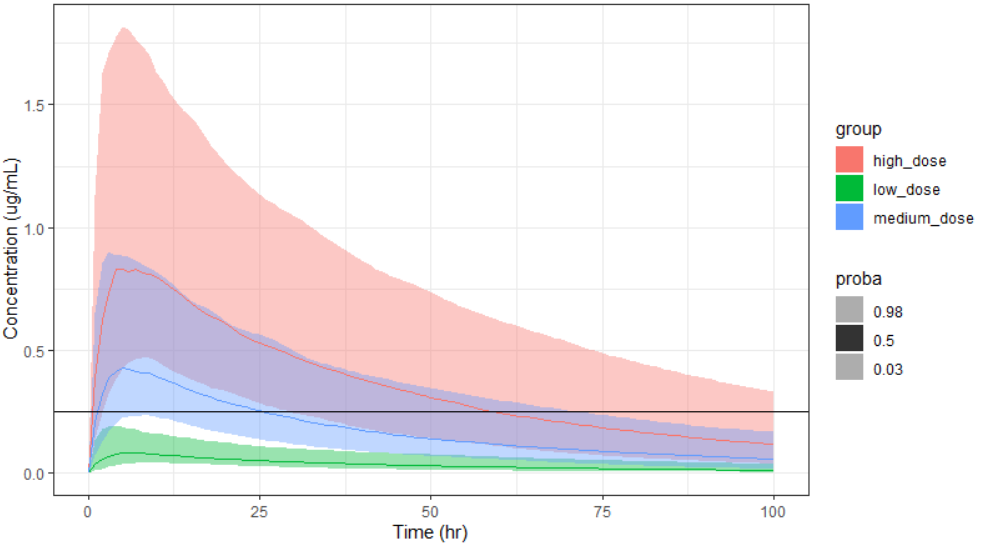
To display the prediction intervals on top of each other, use facet=F. As a ggplot object is returned, additional ggplot functions can be used to overlay additional features or modify the legend, etc.
prctilemlx(project=project.file, outputVariableName = "Cc", facet=F, number=2, level=95) + ylab("Concentration (ug/mL)") + xlab("Time (hr)") + geom_hline(yintercept = 0.25)
See also http://simulx.webpopix.org/mlxr/prctilemlx/ for more examples.
- simulx() to run the simulation [documentation under construction]
- writeData() to write the simulation results to a MonolixSuite compatible format
- prctilemlx() to plot prediction intervals (with overlay of the groups on a single plot)
writeData(): write simulations to MonolixSuite data set format
Description
Format outputs of simulx simulations and write datasets in monolix and pkanalix project format.
Usage
writeData(
  project = NULL,
  filename = "simulated_dataset.csv",
  sep = ",",
  ext = "csv",
  nbdigits = 5
)
Arguments
project |
(string) a simulx project with extension .smlx. If no project is specified, the function will run on the project that is already loaded. |
filename |
(string) (optional) file path to dataset. (default “simulated_dataset.csv”) In case of multiple replicates, the function creates one dataset per replicate with name $filename_repi If filename contains an extension, it must be “csv” or “txt”. If it does not, extension is defined by ext argument. |
sep |
(string) (optional) Separator used to write dataset file. (default “,”) It must be one of “\t”, ” “, “;”, “,” |
ext |
(bool) (optional) Extension used to write dataset file. (default “csv”) It must be one of “csv”, “txt” To defined only if filename with no extension |
nbdigits |
(integer) (optional) number of decimal digits in output file. (default = 5) |
Details
The generated data set has the following headers: id, occ (if occasions have been used), time, amt, adm, rate, y (observations), ytype (observation id), evid (if a washout was defined), and the covariates names.
WARNING: writeData function is not implemented for simulx project with regressors in MonolixSuite version 2020R1. When a loq is defined in the simulx() function, it is not taken into account when writing the data set.
Value
a dataframe if one single simulation, a list of dataframes if multiple replicates.
Examples
The Simulx-GUI demo simulates a PK/PD data set. The saved data set has the standard format to be loaded in Monolix or Simulx.
project.file <- "~/../lixoft/simulx/simulx2020R1/demos/1.overview/importFromMonolix_resimulateProject.smlx"
writeData(project=project.file, filename = "simdata.csv")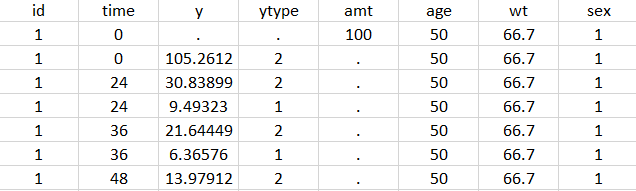
prctilemlx(): prediction interval plots
Description
Compute and plot percentiles of the empiricial distribution of longitudinal data. When several groups are present, the groups can be plotted as subplots or as different colors on one plot. The input can be a R object (parameter r) or a monolix project and a variable name (arguments project and outputVariableName).
Usage
prctilemlx(
  r = NULL,
  col = NULL,
  project = NULL,
  outputVariableName = NULL,
  number = 8,
  level = 80,
  plot = TRUE,
  color = NULL,
  group = NULL,
  facet = TRUE,
  labels = NULL,
  band = NULL
)
Arguments
r |
a data frame with a column id, a column time and a column with values. The times should be the same for all individuals. |
col |
a vector with the three column indexes for id, time and y. Default = c(1,2,3). |
project |
simulx project filename (with extension “.smlx”) |
outputVariableName |
name of the output to consider. By default the first output will be consider. You must define either a ‘r’ dataframe (and the associated ‘col’ argument) or a simulx project and the name of the output ‘outputVariableName” |
number |
the number of intervals (i.e. the number of percentiles minus 1). |
level |
the largest interval (i.e. the difference between the lowest and the highest percentile). |
plot |
if TRUE the empirical distribution is displayed, if FALSE the values are returned |
color |
colors to be used for the plots In case of one group or facet = TRUE, only the first color will be used |
group |
variable to be used for defining groups (by default, ‘group’ is used when it exists) |
facet |
makes subplots for different groups if TRUE |
labels |
vector of strings |
band |
is deprecated (use number and level instead) ; a list with two fields
|
Details
You must define either a dataframe r (and if needed the associated col argument) or a simulx project and the name of the output outputVariableName. The outputVariableName corresponds to the name of the model variable, not to the output element name.
Value
a ggplot object if plot=TRUE ; otherwise, a list with fields:
- proba: a vector of probabilities of length
band$number+1 - color: a vector of colors used for the plot of length
band$number - y: a data frame with the values of the empirical percentiles computed at each time point
Examples
This simulx-GUI demo project contains 3 simulation groups, with a low, medium or high dose. In the Simulation tab, the output element ‘regularCc’ is selected, to output the variable ‘Cc’ on a regular time grid.
With facet=T (default), each group is displayed on a separate subplot with the different shades representing different percentiles. The largest band represents the 90% prediction interval.
project.file <- "~/../lixoft/simulx/simulx2020R1/demos/5.simulation/simulationGroups_treatment.smlx"
prctilemlx(project=project.file, outputVariableName = "Cc")
With number=2 and level=95, we can select to display only the median and the 95% prediction interval.
project.file <- "~/../lixoft/simulx/simulx2020R1/demos/5.simulation/simulationGroups_treatment.smlx"
prctilemlx(project=project.file, outputVariableName = "Cc", number=2, level=95)
To display the prediction intervals on top of each other, use facet=F. As a ggplot object is returned, additional ggplot functions can be used to overlay additional features or modify the legend, etc.
prctilemlx(project=project.file, outputVariableName = "Cc", facet=F, number=2, level=95) + ylab("Concentration (ug/mL)") + xlab("Time (hr)") + geom_hline(yintercept = 0.25)
See also http://simulx.webpopix.org/mlxr/prctilemlx/ for more examples.
writeData(): write simulations to MonolixSuite data set format
Description
Format outputs of simulx simulations and write datasets in monolix and pkanalix project format.
Usage
writeData(
  project = NULL,
  filename = "simulated_dataset.csv",
  sep = ",",
  ext = "csv",
  nbdigits = 5
)
Arguments
project |
(string) a simulx project with extension .smlx. If no project is specified, the function will run on the project that is already loaded. |
filename |
(string) (optional) file path to dataset. (default “simulated_dataset.csv”) In case of multiple replicates, the function creates one dataset per replicate with name $filename_repi If filename contains an extension, it must be “csv” or “txt”. If it does not, extension is defined by ext argument. |
sep |
(string) (optional) Separator used to write dataset file. (default “,”) It must be one of “\t”, ” “, “;”, “,” |
ext |
(bool) (optional) Extension used to write dataset file. (default “csv”) It must be one of “csv”, “txt” To defined only if filename with no extension |
nbdigits |
(integer) (optional) number of decimal digits in output file. (default = 5) |
Details
The generated data set has the following headers: id, occ (if occasions have been used), time, amt, adm, rate, y (observations), ytype (observation id), evid (if a washout was defined), and the covariates names.
WARNING: writeData function is not implemented for simulx project with regressors in MonolixSuite version 2020R1. When a loq is defined in the simulx() function, it is not taken into account when writing the data set.
Value
a dataframe if one single simulation, a list of dataframes if multiple replicates.
Examples
The Simulx-GUI demo simulates a PK/PD data set. The saved data set has the standard format to be loaded in Monolix or Simulx.
project.file <- "~/../lixoft/simulx/simulx2020R1/demos/1.overview/importFromMonolix_resimulateProject.smlx"
writeData(project=project.file, filename = "simdata.csv")
