The results tab displays the simulated values and the outcomes and endpoints as tables.
Result tables are organized into three sections:


Simulation
The simulation tab displays the simulated output values and the sampled individual parameters.
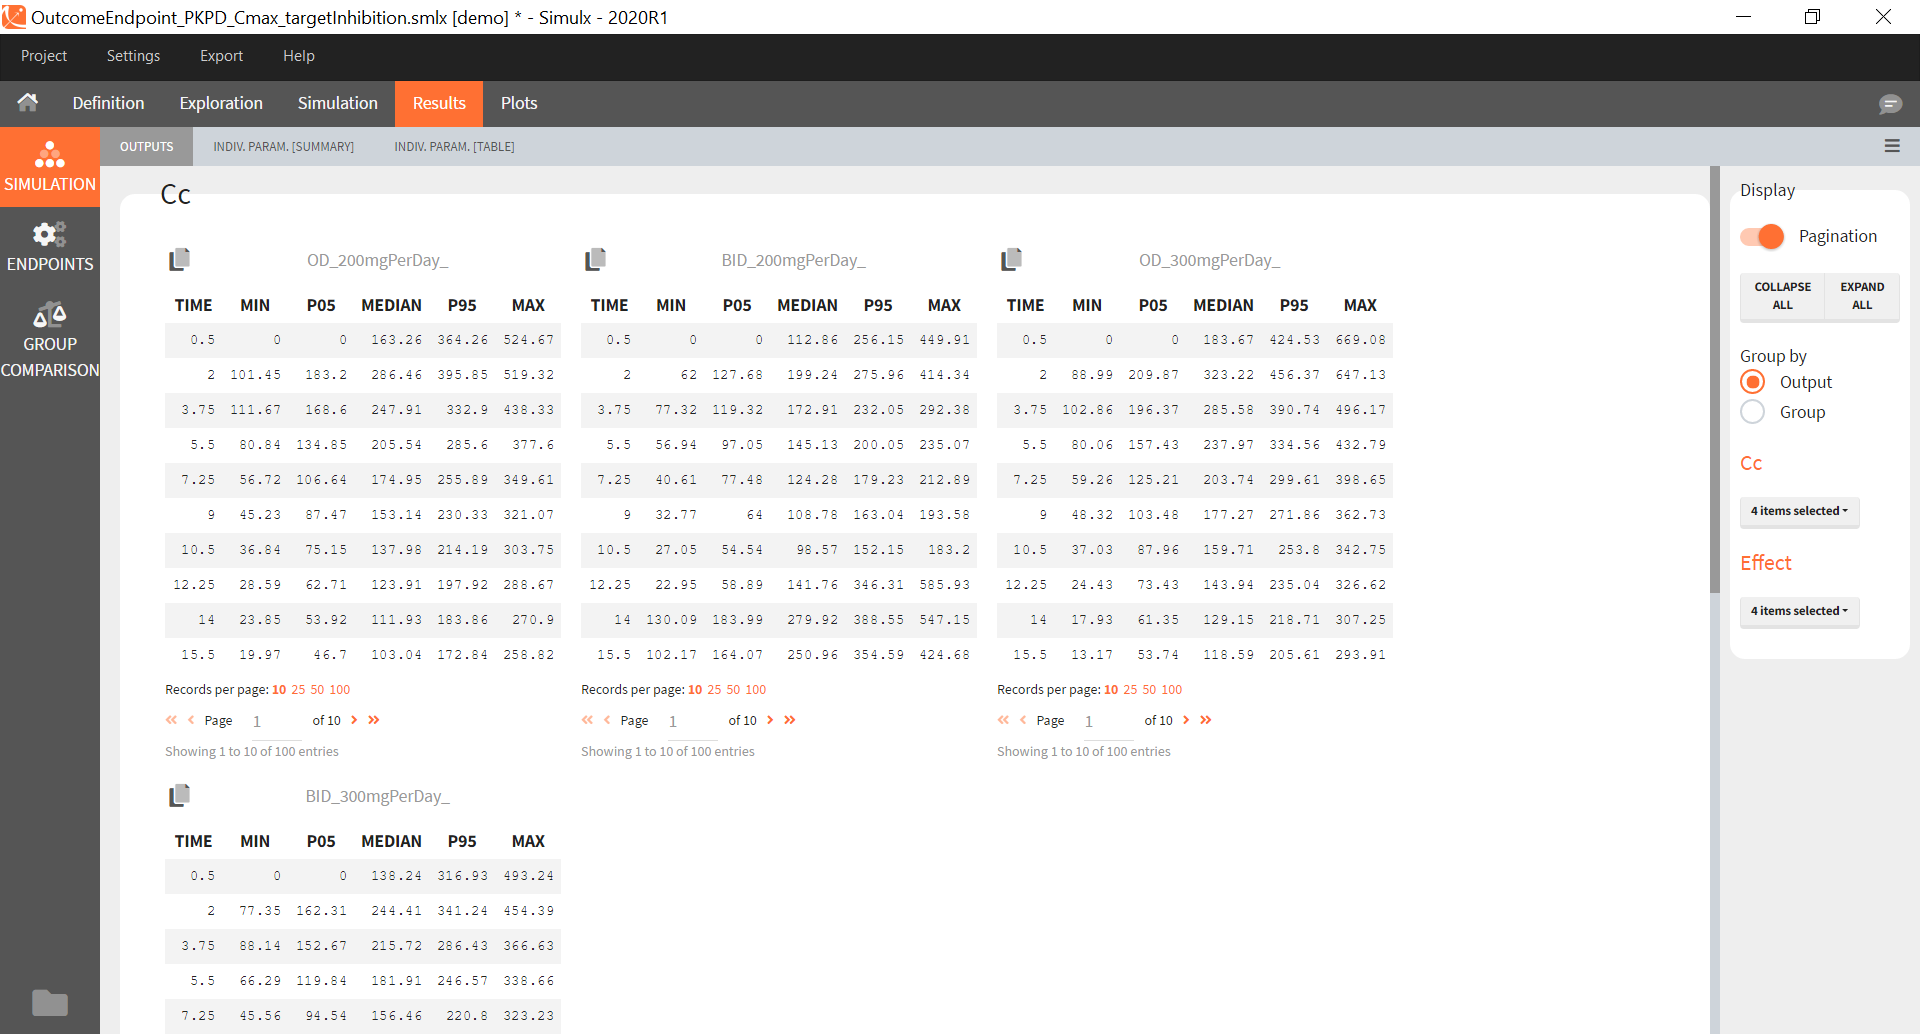
Outputs
Because the simulated output values are usually a very large table, the results are presented as percentiles for continuous simulations (minimum, 5th percentile, median, 95th percentile and maximum) and as percentage of survival and average number of events for time-to-event simulations. These statistics are calculated over time bins calculated automatically. When replicates are used, the statistics are calculated over all replicates merged together. Each simulation group is displayed as a separate table.
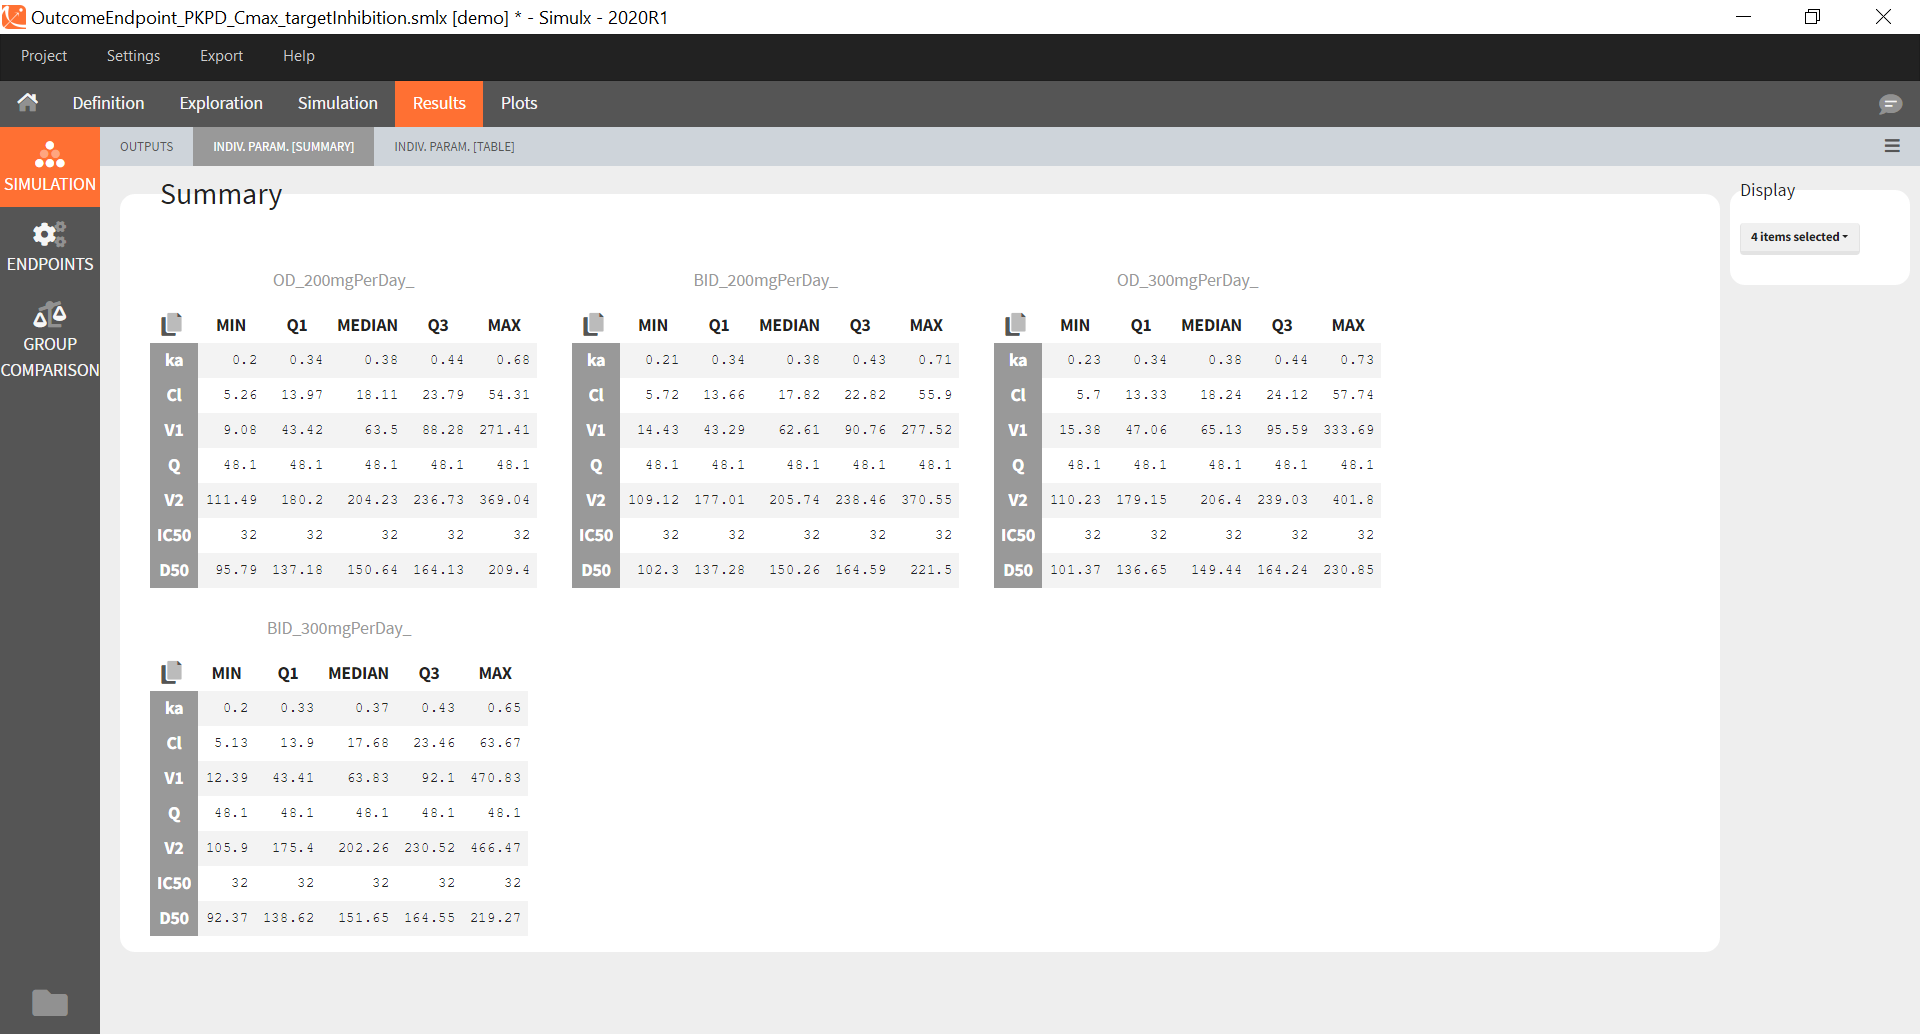
Individual parameters [Summary]
This tab displays the percentiles summarizing the distribution of individual parameters used for simulation for each of the groups. These parameters have been either directly defined by the user or sampled from the population parameters defined by the user. As for the simulated outputs, the statistics are calculated over all replicates merged together.
Individual parameters [Table]
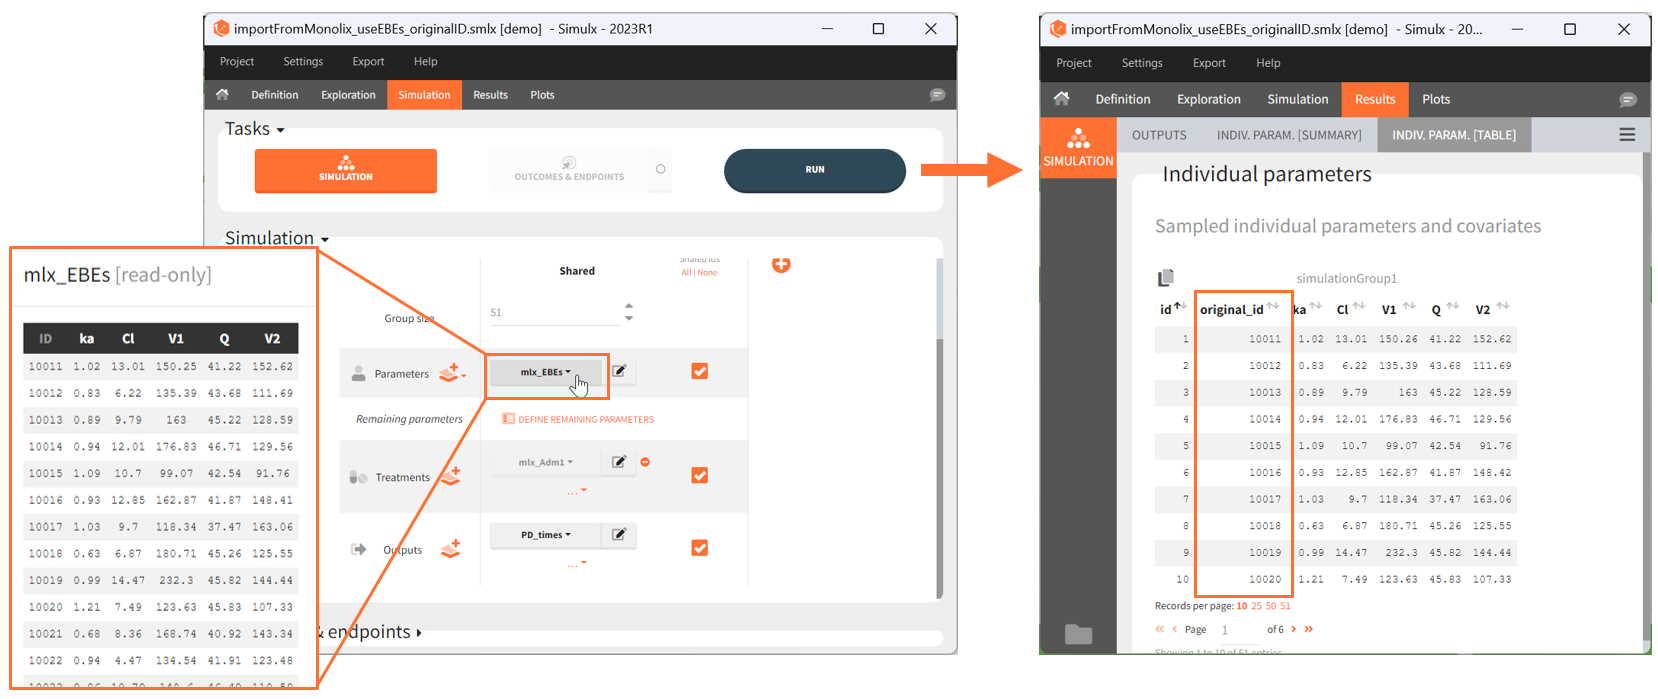
This tab displays the full tables of individual parameters for all replicates and for all groups. The content of these tables can also be found in a table gathering all groups in the result folder>Simulation>individualParameters.txt .
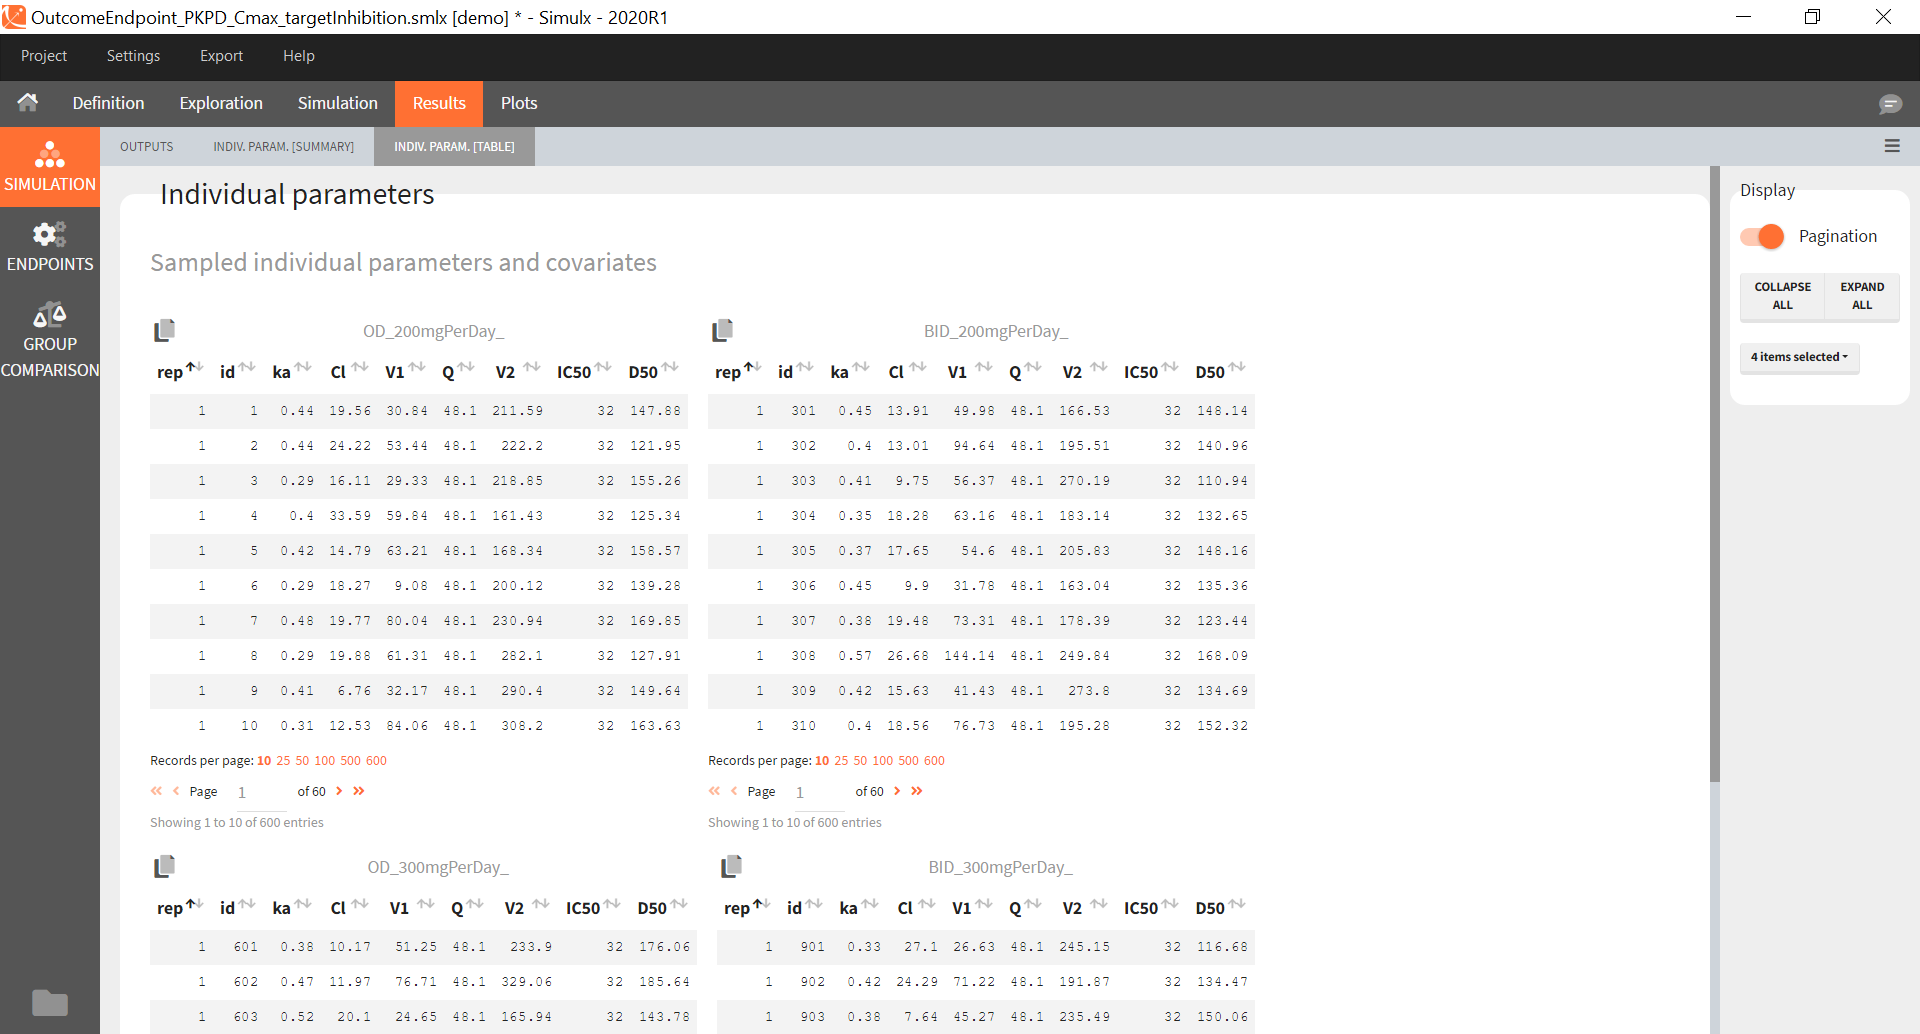
The id column in these tables is the simulated id, meaning that id i is the i-st parameter set sampled for simulation.
Since the version 2023R1, if elements using original id lists have been used for simulation, for example a table of individual treatments, or a table of individual parameters, the original ids in these tables is reported in the individual parameter tables in the “original_id” column. For example in the demo project “importFromMonolix_useEBEs_originalID.smlx”, we use the element mlx_EBEs which is a table of individual parameters. The original IDs used in this table are reported in the sampled individual parameters table, together with the simulated id. The original id is also reported in the output files.
If a simulated id uses information coming from several original ids (e.g when a table a individual parameters and a table of treatment is used by the “shared ids” option is not selected), then the original id is not displayed in the GUI but it can be found in the result folder in the file ID_mapping.txt.

Endpoints
The endpoints section appears if an outcome has been defined in the simulation tab, to post-process the simulation results.
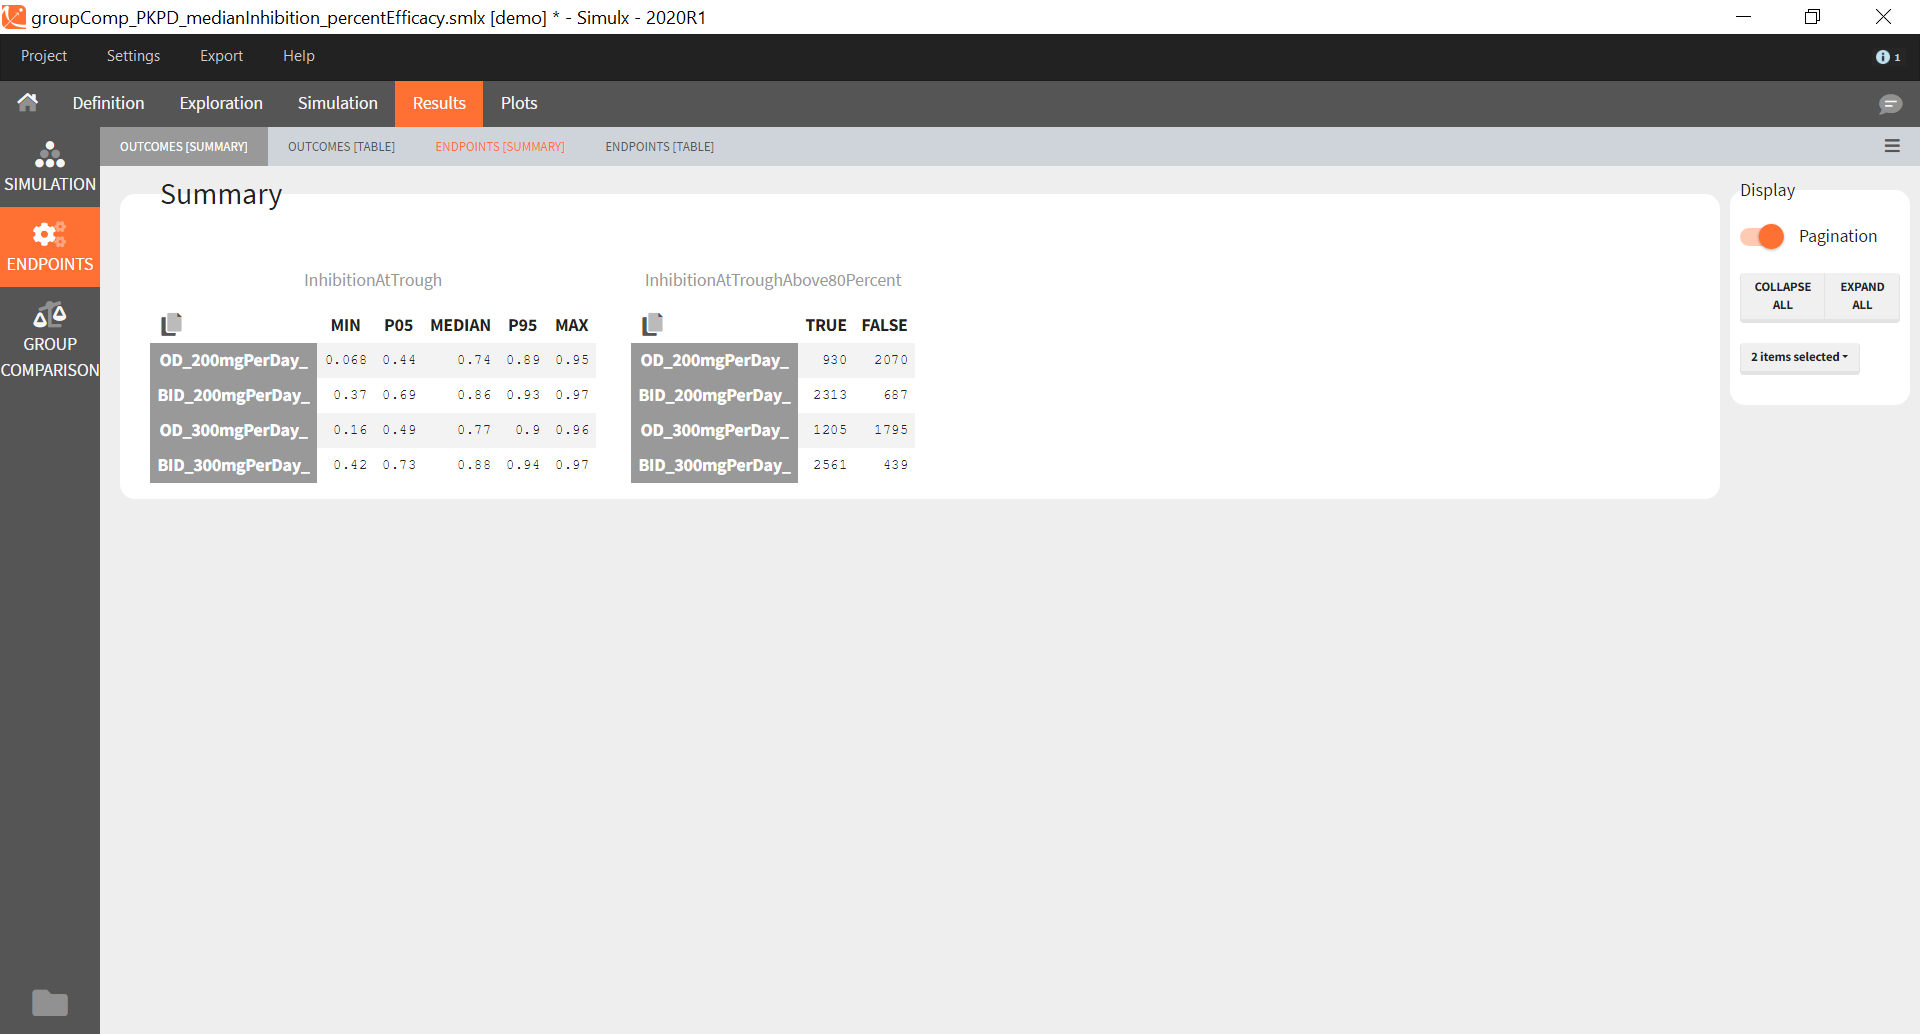
Outcomes [Summary]
The summary shows one table per outcome, displaying the percentiles over individuals and replicates for each group if the outcome is continuous, and the number of true and false individuals if the outcome is a boolean.
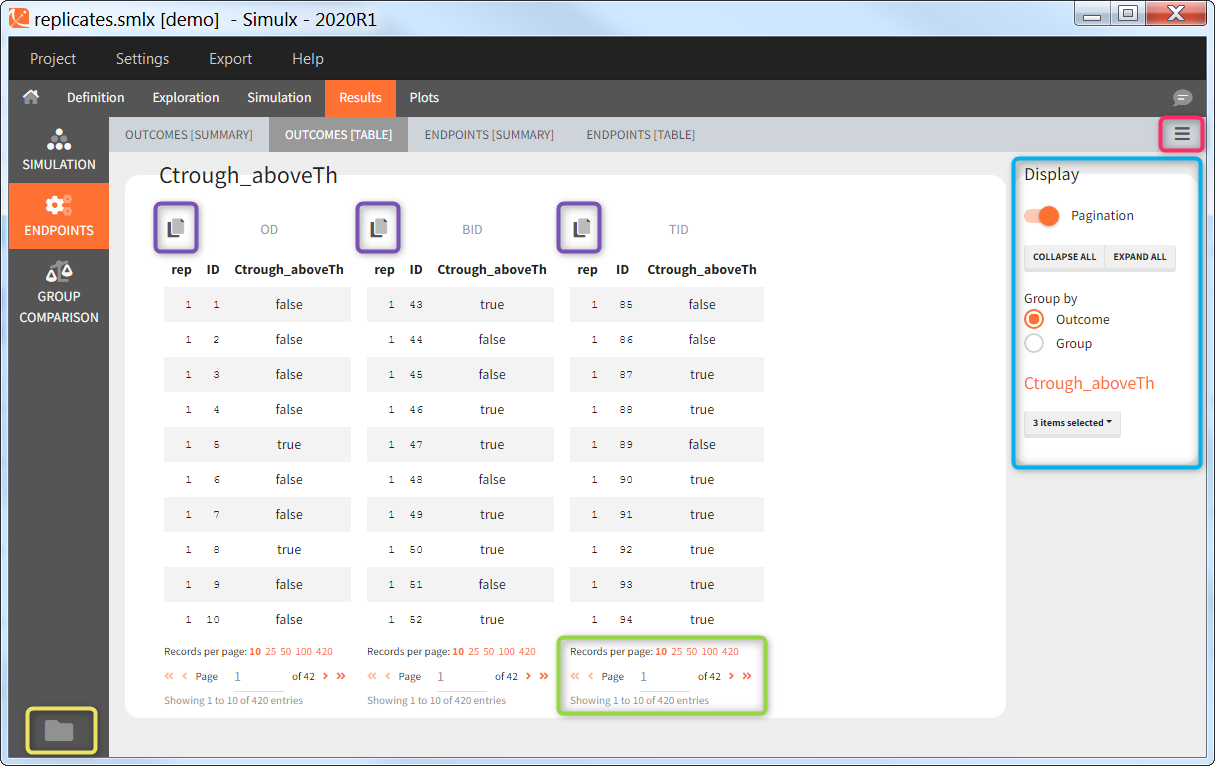
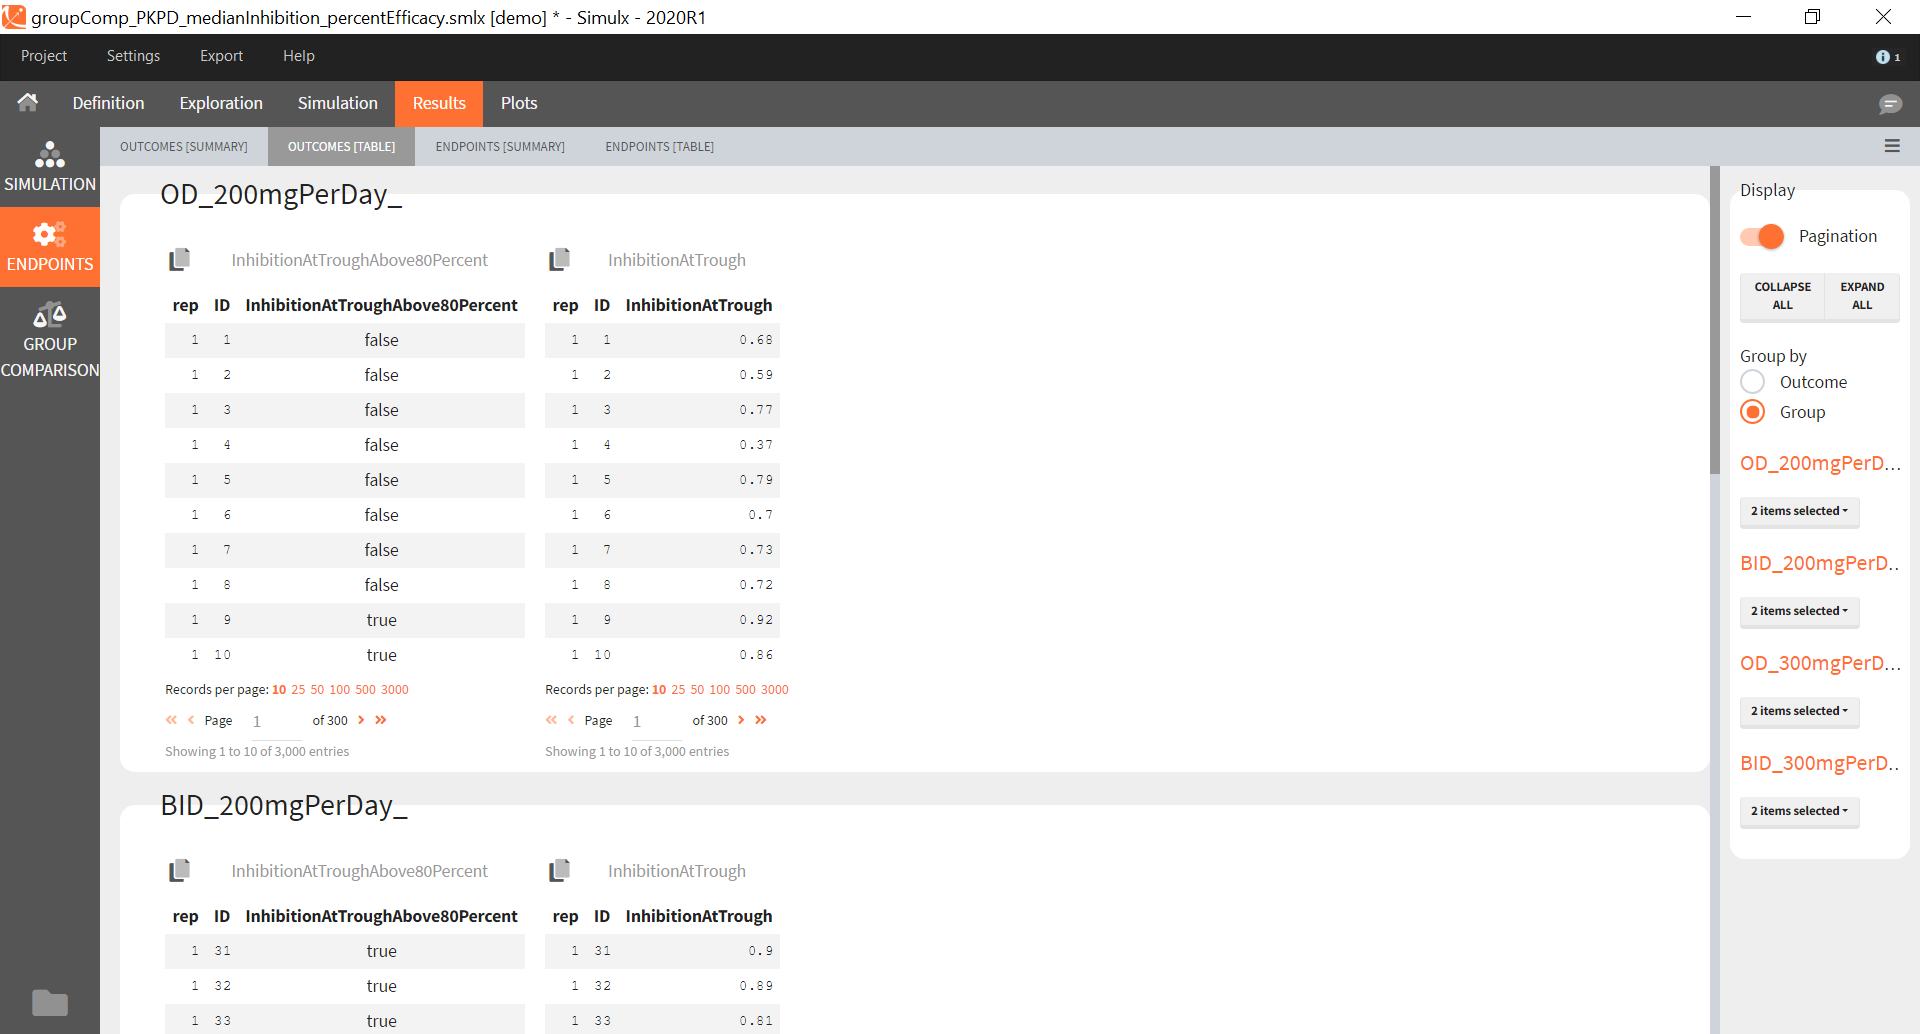
Outcomes [Table]
The outcomes table shows the outcome values for all individuals. A table of all values for each outcome also appears the result folder/Endpoints.
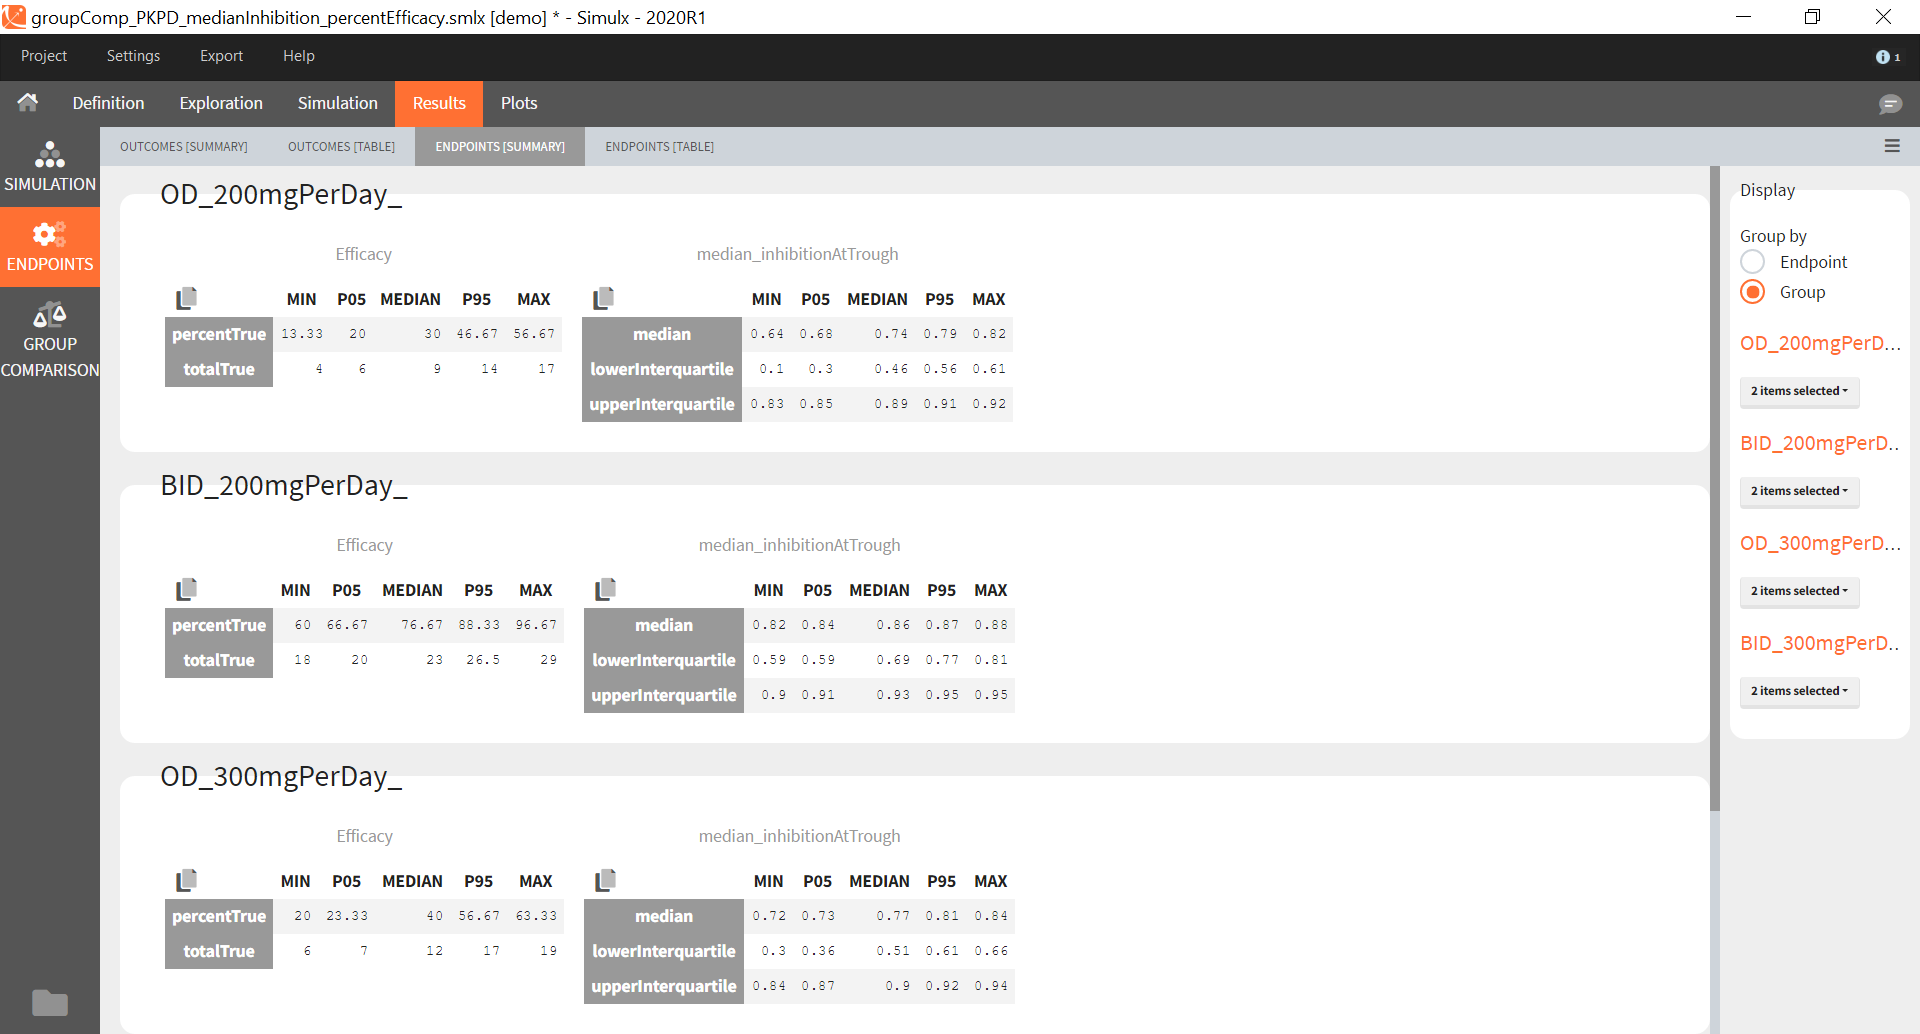
Endpoints [Summary]
Endpoints summarize the outcome values over all individuals for a specific group and replicate. The endpoints summary shows percentiles for the calculated endpoint over replicates. These percentiles give the uncertainty of the endpoint value over several clinical trial simulations.
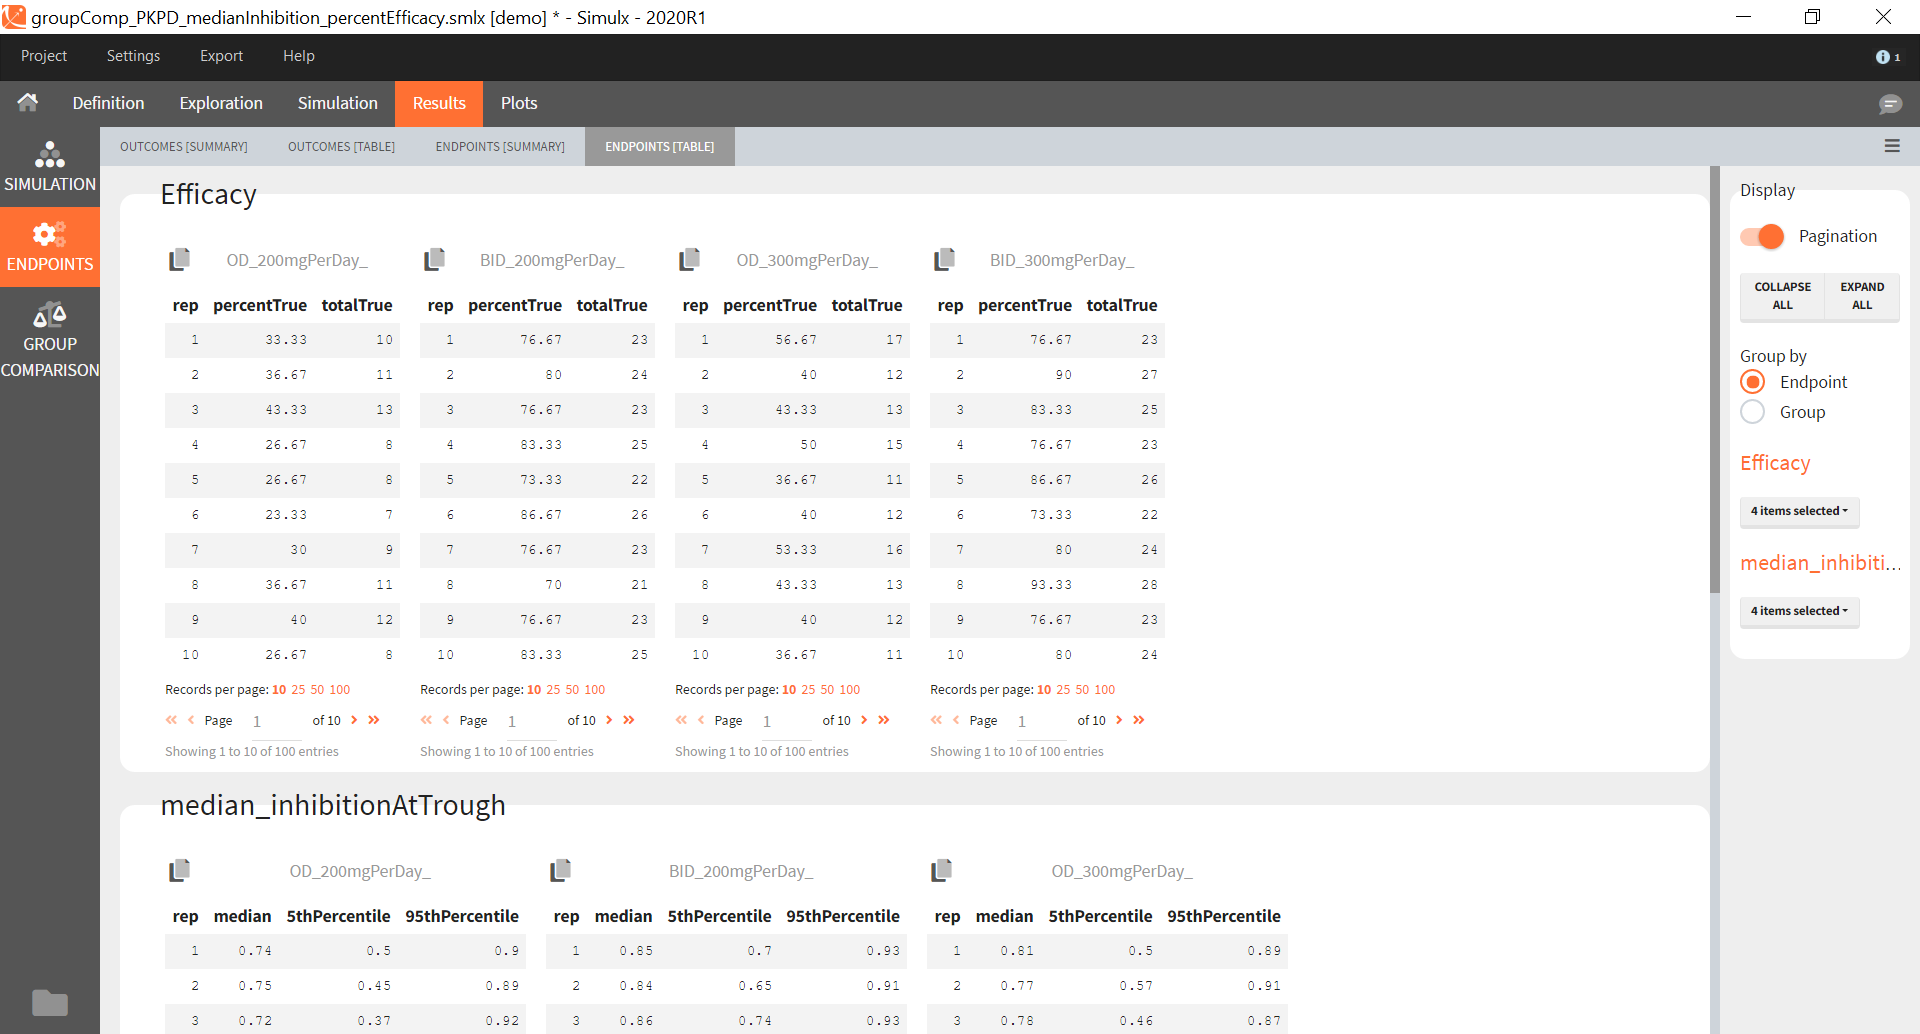
Endpoints [Table]
The endpoints table shows the value of the endpoint defined in the simulation tab for each group and each replicate. A table for each endpoint is also saved in the result folder/Endpoints.
Group Comparison
If several simulation groups are used, and if group comparison is checked in the simulation tab, the group comparison section appears in the results.
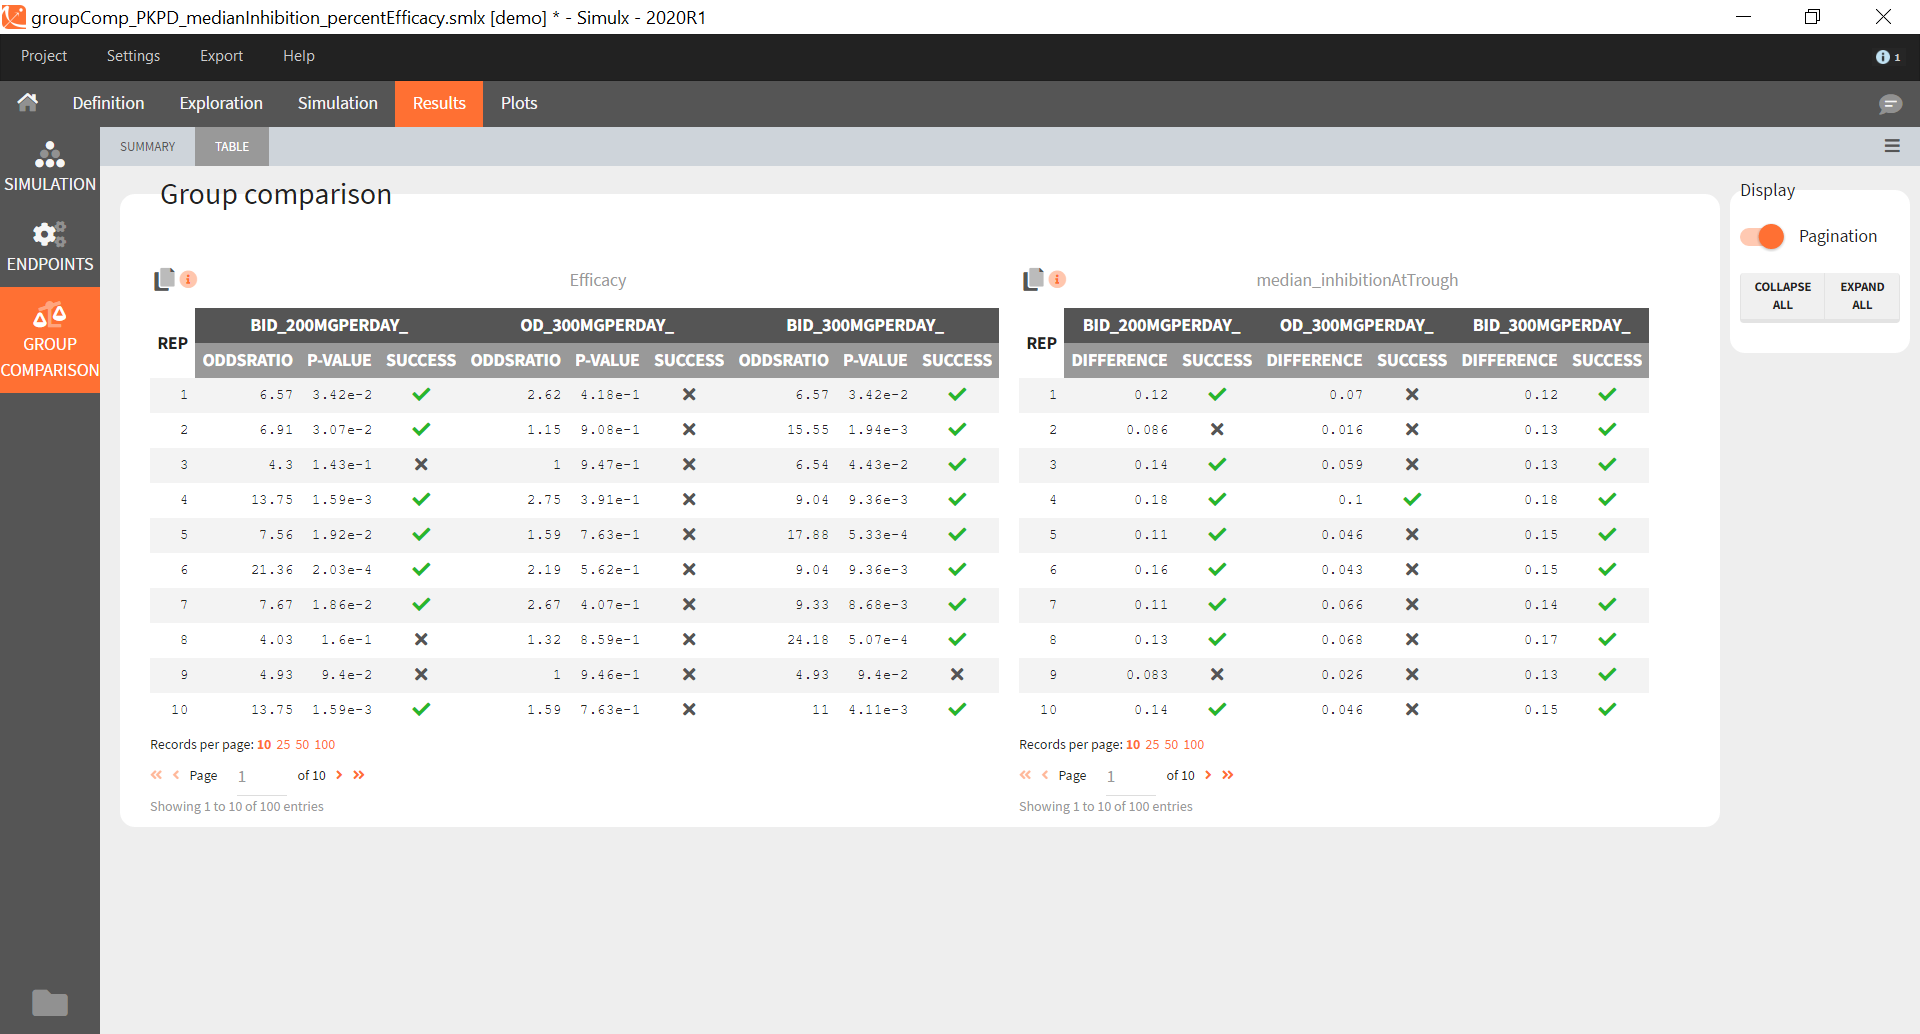
Group comparison Table
For each replicate study, a test comparing the groups is performed as defined in the group comparison section of the simulation tab. The statistics of the test, p-value and the resulting decision (success or failure) according to the defined criteria are reported for each group (compared to the reference group) and for each replicate. A table is also saved for each statistical test and for each decision criterion in the result folder/Endpoints.
Group comparison Summary
The summary of group comparison shows for each group the percentage of replicates that led to a successful test.
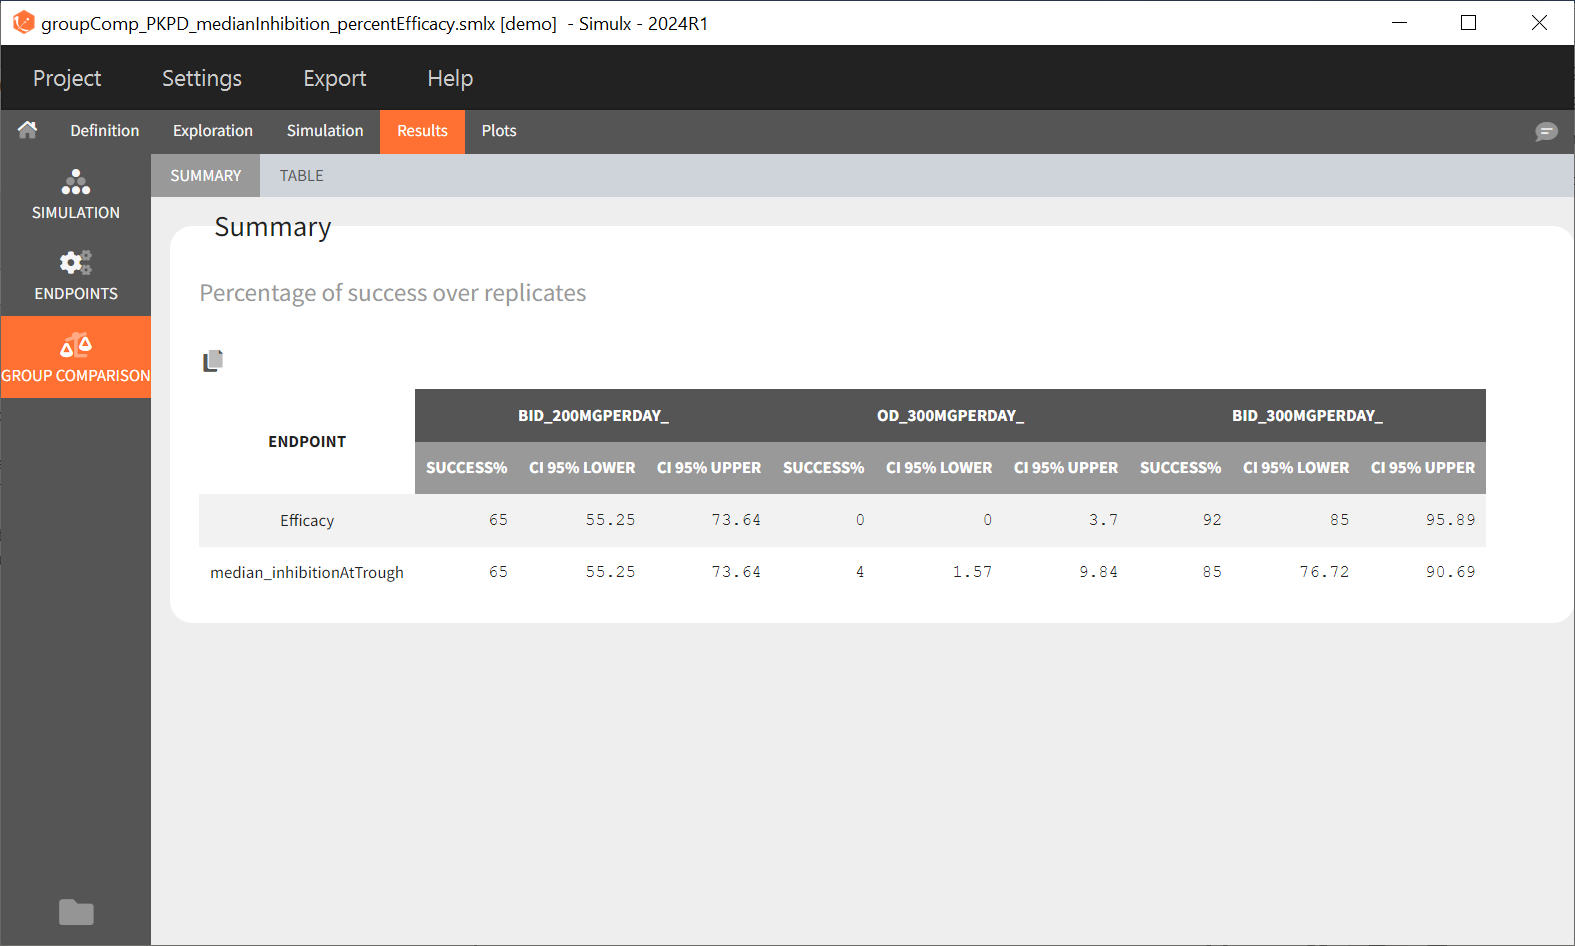
Starting from version 2024R1, the success rate across the replicates is now complemented by the corresponding confidence interval. The formula is based on the Wilson interval formula given by:
\( CI_W = \frac{X + \kappa^{2}/2}{n + \kappa ^{2}} \pm \frac{\kappa ~\sqrt{ n}}{n+ \kappa ^{2}}\sqrt{\hat{p}\hat{q}+\kappa^{2}/(4n)} \),
where \(n\) is the number of replicates, \(X\) the number of successful trials over the replicates, \( \hat{p}=\frac{X}{n}\) corresponds to the rate of successful trials, \( \hat{q} =(1-\hat{p})\) to the rate of unsuccessful trials. \( \kappa\) corresponds to the \( \alpha\) level’s \( z\) -score, where \( \alpha= \)0.05 for a 95% confidence interval.
Export Simulations
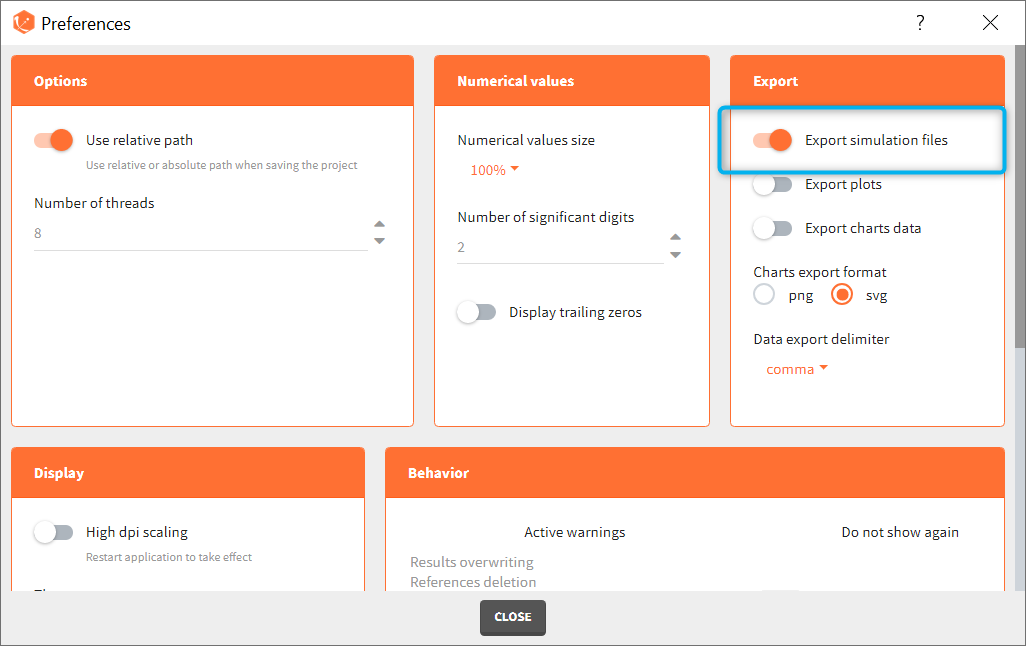
Export simulations as output files at each run
The full table of simulated values can be generated at each run if the preference setting “Export simulation files” is true. It will then appear in the result folder > Simulation > simulation_xxx.txt with xxx the output variable name.
Export simulations as a Monolix or PKanalix project
Note that this option not available in Simulx versions prior to 2023.
After running simulations, it is possible to generate a new Monolix or PKanalix project using the simulated values as dataset. This can be done from the menu Export > Export project to:
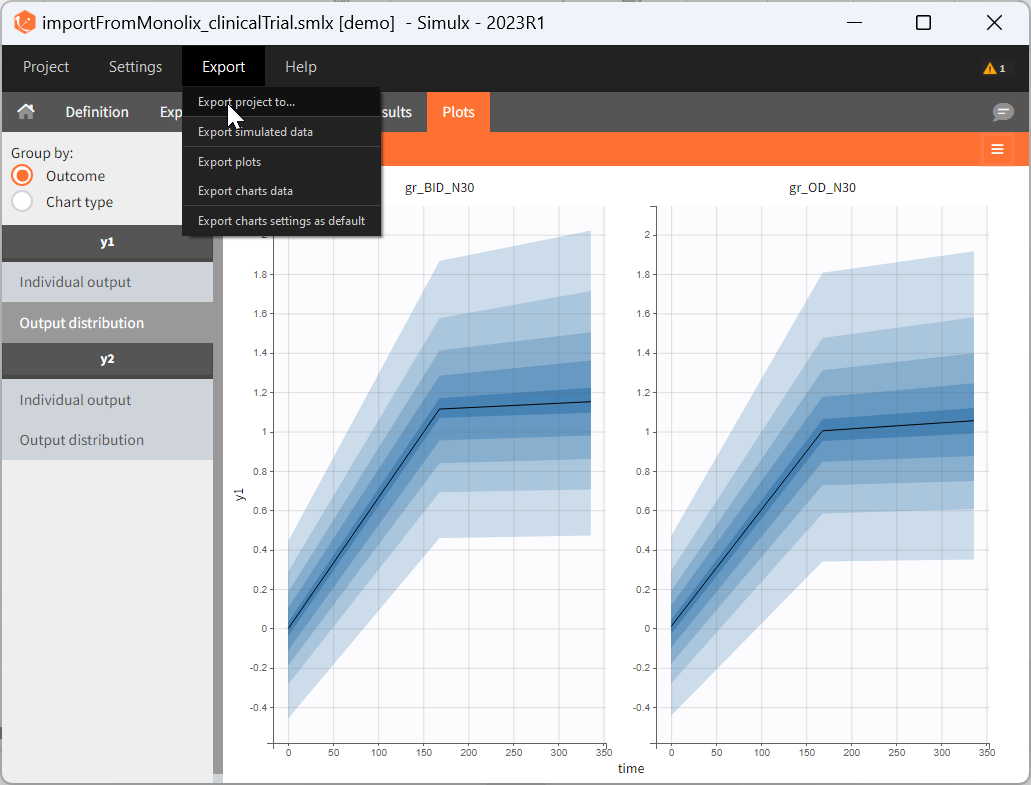
In the pop-up window, you can choose:
- to which application you want to export the simulated dataset: PKanalix or Monolix.
- names to the generated dataset (based on simulations) and generated model file (if the model is not part of the library).
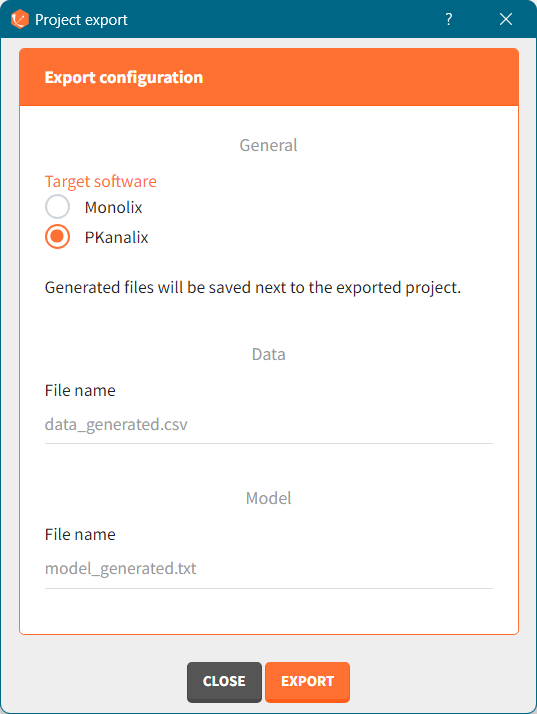
Click the “EXPORT” button at the bottom to confirm. The target application (Monolix or PKanalix) will open automatically with a predefined project called “untitled”. The simulated dataset and model files (if not from the library) will be copied next to the new new project – first in the temporary folder, when the project is “untitled”, then to the final destination, where you save the project.
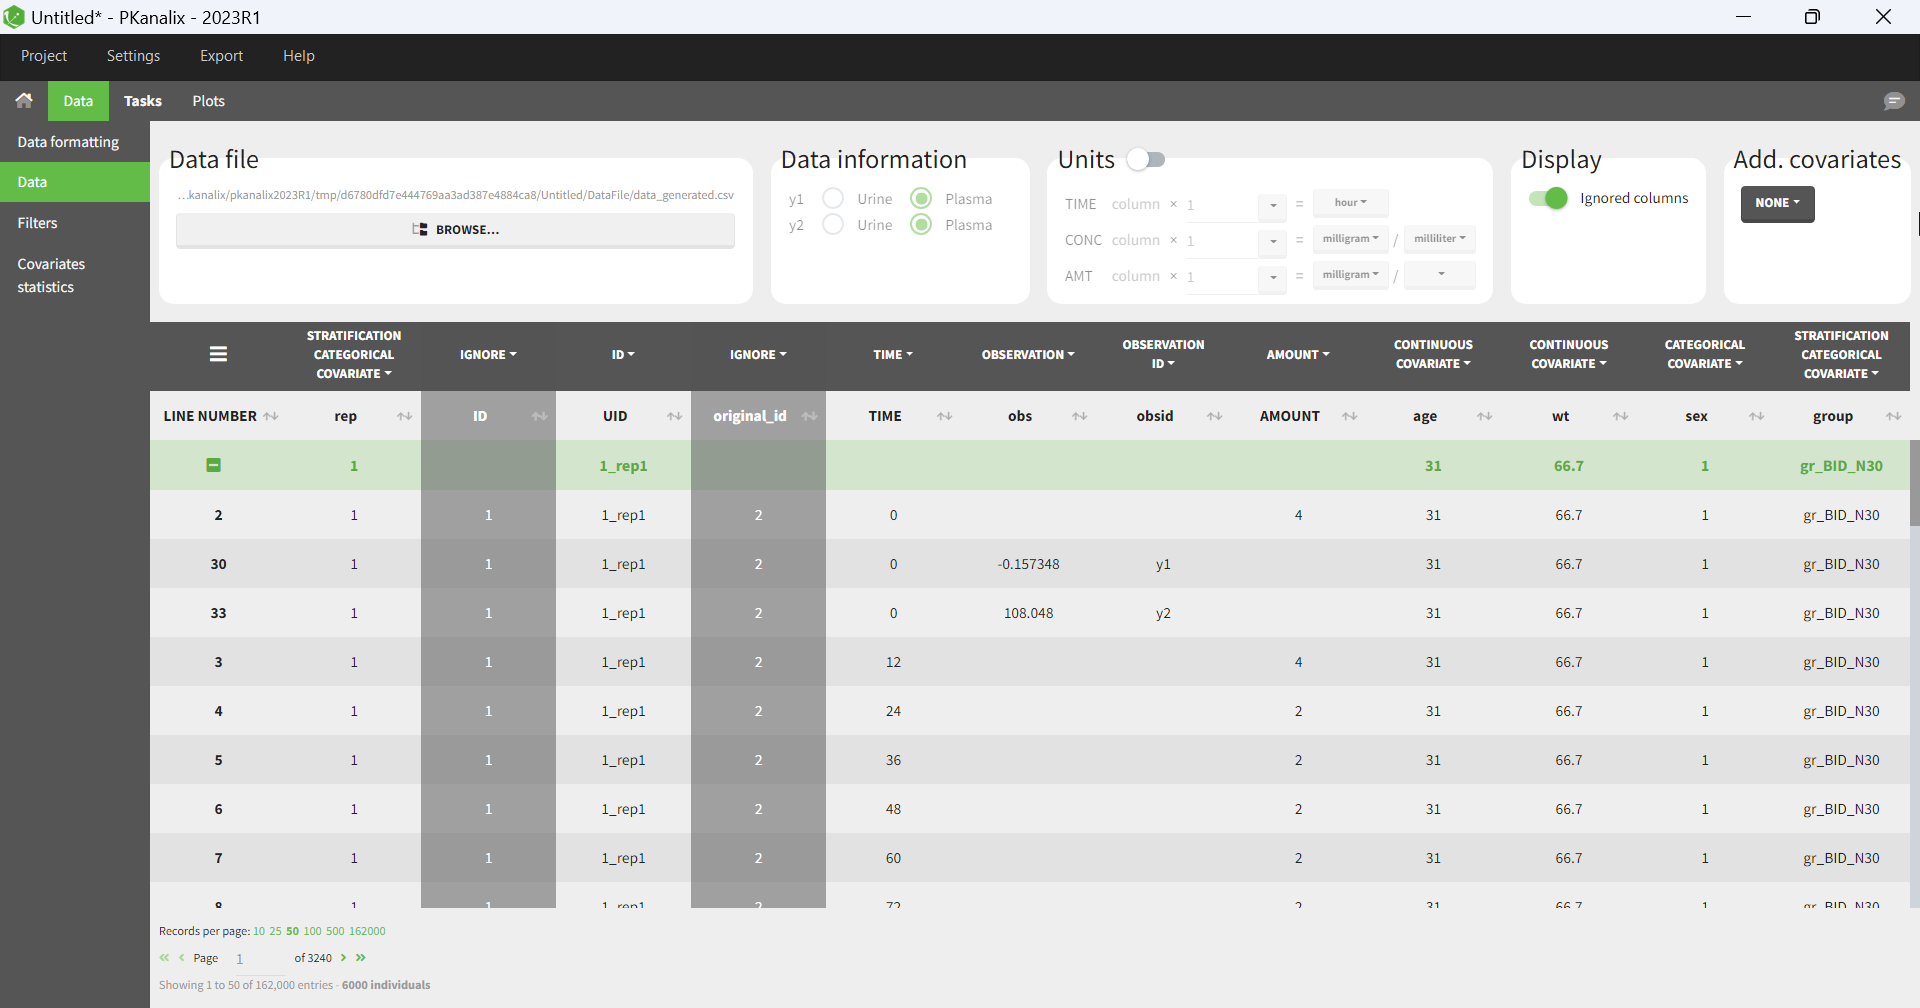
The dataset in the new project will be set in the following way:
- A column ID contains the identifiers for the individuals simulated in the Simulx project. It is tagged as ID if no replicates have been used in Simulx.
- If replicates have been simulated, a UID column containing a unique identifier combining replicate and ids (eg 1_rep1) is tagged as ID, and a rep column indicates the replicate (it is possible to use filters to select a single replicate if necessary).
- If external elements have been used in Simulx, original IDs coming from these elements are indicated in a column original_id which is ignored by default, but can be tagged by the user as categorical covariate or ID, depending on the situation.
- Simulation groups are given in a column group tagged as stratification categorical covariate.
- If several model outputs are simulated, the output names are indicated in an obsid column tagged as observation ID.
- Pre-defined tagging is used for time, observation, amount, and simulated covariates.
For an export to PKanalix, the new project will be set in the following way:
- the data is set as described above.
- NCA settings: default PKanalix settings for administration type, integral method, treatment of BLQ values, parameters
- NCA settings: “observation ID to use” set to the first one alphabetically (if obsid are strings) or numerically (if obsid are integers).
- Acceptance criteria: not selected.
- Bioequivalence: default PKanalix settings
- the structural model is set to the generated model file attached to the new project, or a model from the library if the Simulx project used a library model.
- The generated structural model only includes the [LONGITUDINAL] block of the Simulx model, without the error model.
- If a statistical model was used in simulx (observation or individual model), it is not included in the generated model file for PKanalix.
- The mapping automatically links the simulated observations to the model outputs.
- If additional lines were used in the Simulx project, they are added at the end of the generated structural model file.
- If output elements are defined based on intermediate variables of the model in the Simulx project, they are added to the output section of the model.
- The mapping automatically links the simulated observations to the model outputs. If a statistical model was used in simulx (observation or individual model), it is not included in the generated model file for PKanalix. The generated model only includes the [LONGITUDINAL] block without DEFINITION section.
- CA initial parameter values: set to default
- CA parameters constraints: none for normally distributed parameters, positive for log-normally distributed parameters; bounded with limits imported from the Monolix project for logit-normally and probit-normally distributed parameters.
- CA calculations settings: default PKanalix settings
For an export to Monolix, the project will be set in the following way:
- the data is set as described above.
- the structural model is set to the generated model file attached to the new project, or a model from the library if the Simulx project used a library model.
- The generated structural model only includes the [LONGITUDINAL] block of the Simulx model, without the error model.
- The mapping automatically links the simulated observations to the model outputs.
- If additional lines were used in the Simulx project, they are added at the end of the generated structural model file.
- If output elements are defined based on intermediate variables of the model in the Simulx project, they are added to the output section of the model.
- Initial values are set to default.
- the observation model and individual model in Monolix statistical model tab is set based on the Simulx project, if a statistical model was defined in the model of the Simulx project (INDIVIDUAL, COVARIATE blocks or error model in the LONGITUDINAL block). Note that the statistical model is not included in the generated model file for Monolix, but it is taken into account in the statistical model tab. Only the Monolix style syntax for the INDIVIDUAL block can be imported to the Monolix project, not the flexible style. When modifications are done to the model for compatibility reasons, Simulx warns you at export to double check the model interpretation in the Monolix project.
- if some part of the statistical model is not defined in the Simulx project, it is set to default in the statistical model tab.
Export simulations as a formatted dataset
Note that this option not available in Simulx versions prior to 2021.
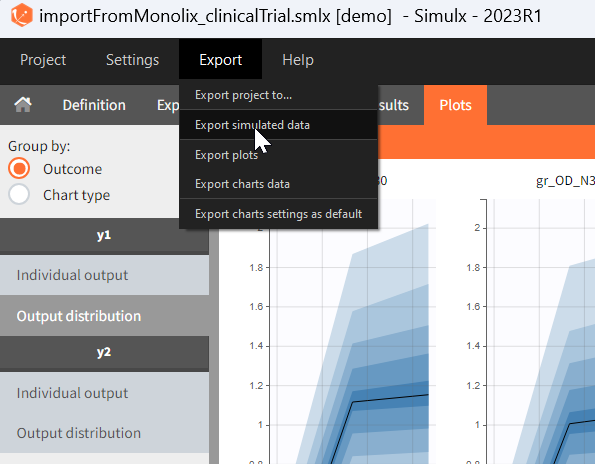
To export simulations as a formatted dataset for further investigations outside the Monolixsuite, it is possible to use the menu Export > Export simulated data. This data set contains the dose, occasions, covariate, simulation groups, observation id informations in addition to the id, time and simulated values. The exported simulated data file is located in the result folder > Simulation > simulatedData.txt.
Share a Simulx project
The 2024 version of MonolixSuite introduces a highly convenient method for sharing projects. Simply click on “Share Project” in the export menu, and a zip folder is generated containing all the required files to re-open the project (dataset if applicable, model if applicable, external files if applicable, smlx file, result folder). By default, the suggested location for the zipped shared project matches that of the original, but this can be easily modified to any other location on the computer.
General display options
The tables generally contain many rows and are by default paginated. The page displayed and the number of records per page can be changed at the bottom (green highlight). The ![]() panel on the right (blue highlight) allows to switch the pagination off in order to show the entire table. The tables can also be all expanded and collapsed. When several groups and several output variables/outcomes/endpoints have been defined, the tables can be grouped by either simulation group or output/outcome/endpoint to easily compare the tables of interest. Finally it is possible to hide some of the simulation groups using the drop-down selection menu. The display panel can be hidden with the button
panel on the right (blue highlight) allows to switch the pagination off in order to show the entire table. The tables can also be all expanded and collapsed. When several groups and several output variables/outcomes/endpoints have been defined, the tables can be grouped by either simulation group or output/outcome/endpoint to easily compare the tables of interest. Finally it is possible to hide some of the simulation groups using the drop-down selection menu. The display panel can be hidden with the button ![]() at the top right. The button
at the top right. The button ![]() on the bottom left opens the result folder which contains the simulated values and their post-processing as text files. All tables can be copied to the clipboard using the button
on the bottom left opens the result folder which contains the simulated values and their post-processing as text files. All tables can be copied to the clipboard using the button ![]() at the top left . Only the displayed page is copied. To copy the entire table, expand it first.
at the top left . Only the displayed page is copied. To copy the entire table, expand it first.